Data Analytics at HL Nexus
Our data analytics services leverage technology and expertise to unlock hidden opportunities and insights.
 We provide the following Data Analytics services:
- Data Collection and Generation
- Data Processing and cleansing
- Data validation
- Modelling and Statistical analysis
What We Do in Data Visualization
Our team of experts use Data Visualization to ensure that comprehensive data can be explored quickly and with the greatest impact.
 Dashboard Designing

HL Nexus plans dashboards based on the contextual understanding of our Client’s business.
Data Visualization Tools
Our Data Visualization Solutions are tailored to our Client’s needs. HL Nexus uses Data Visualization Tools to distil deeper into the data.
Interactive Applications
We offer upgraded user experience by outwardly exploring through data that gives the chance to extract the most extreme insight out of any given informational index.
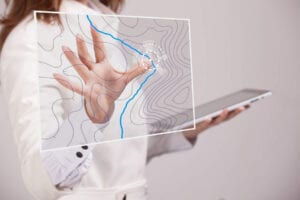 Geovisualization
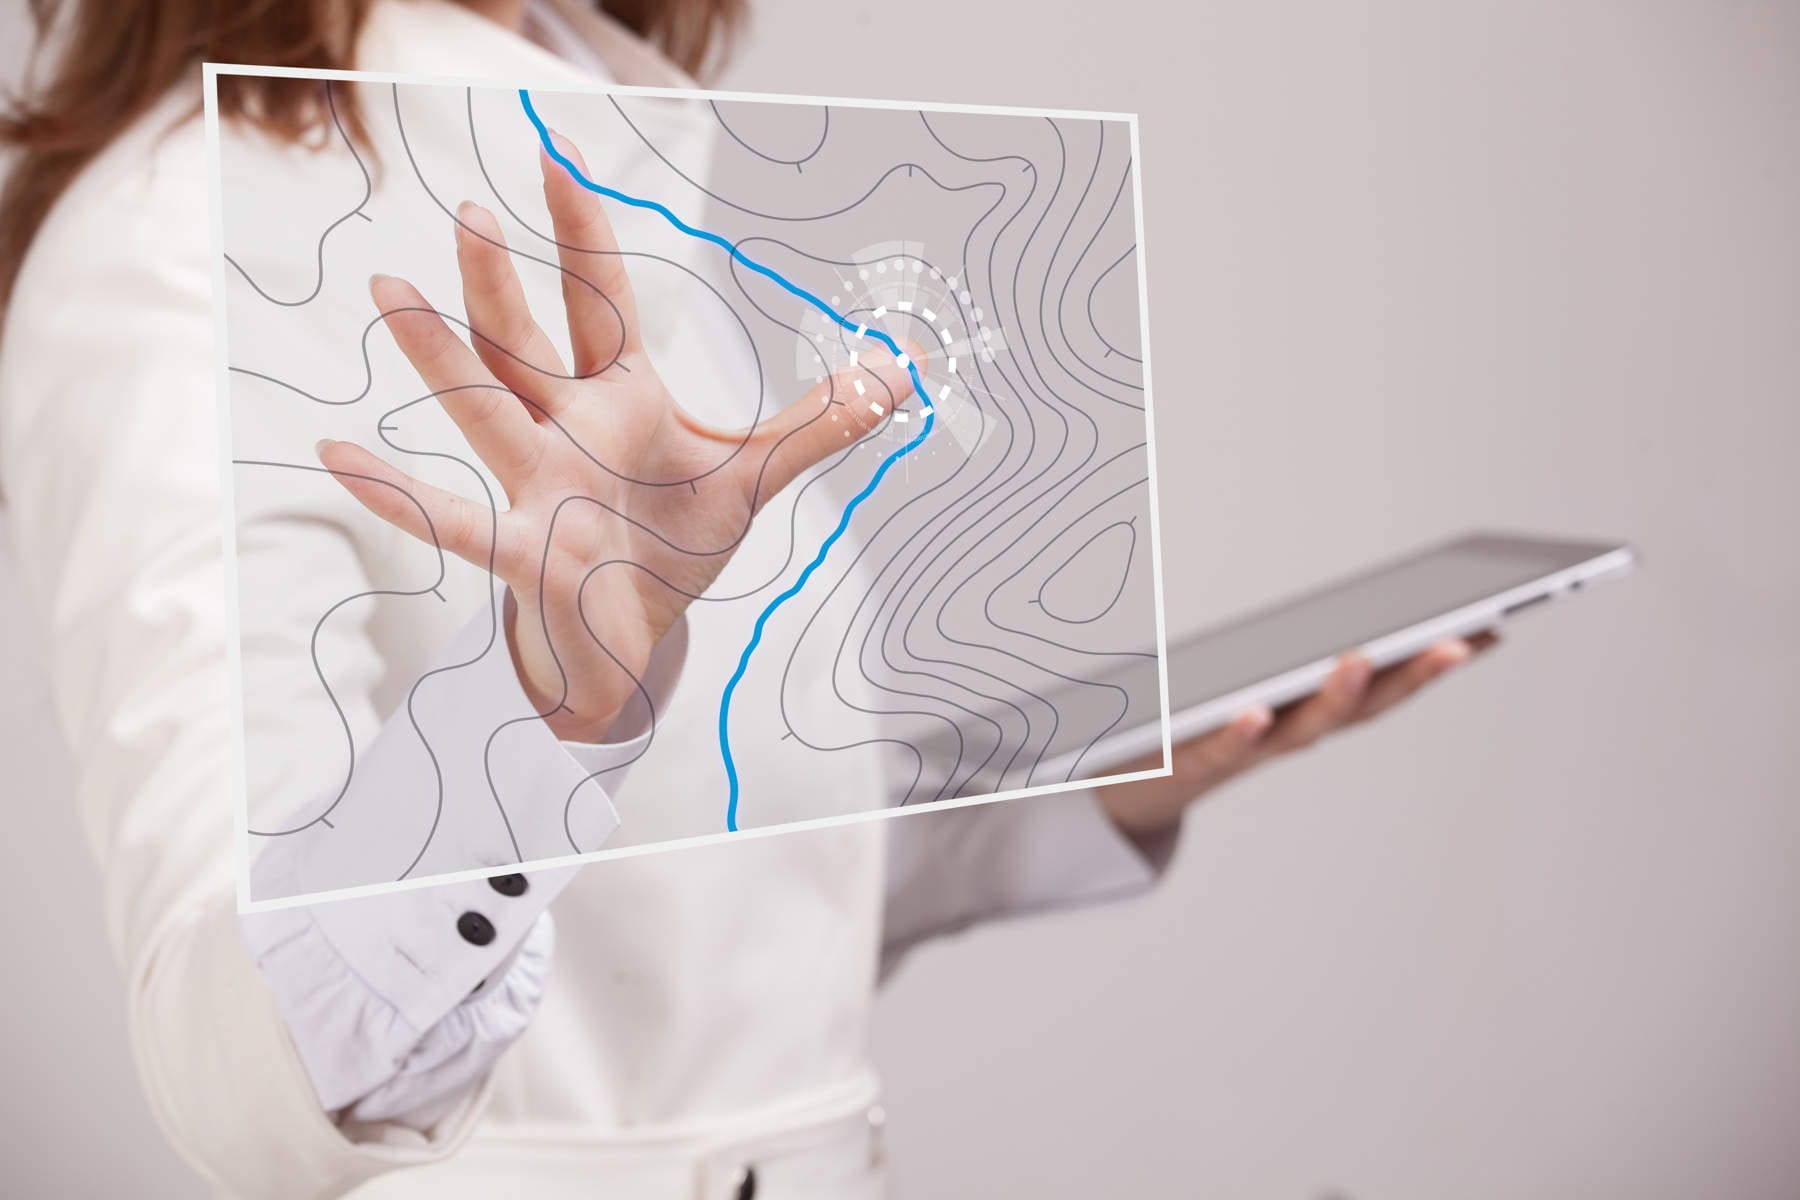
Geovisualization is short for geographic visualization. It is a branch inside visualization that deals exclusively with showing data that has a geospatial component to it.
Types of Data Visualization Services
- Temporal Data Visualization – Ideal for linear one-dimensional visualization.
- Statistical Data Visualization – Ideal for multi-dimensional data elements including numerical and statistical data.
- Hierarchical Data Visualization – Ideal to visualize data entities with dependent-parent relationships.
- Network Data Visualization – Ideal to display relationship between different data sets and analyze the relationship between them.
- 2D Area and Map Data Visualization – Ideal for those whose data is linked to geographic concepts and objects.
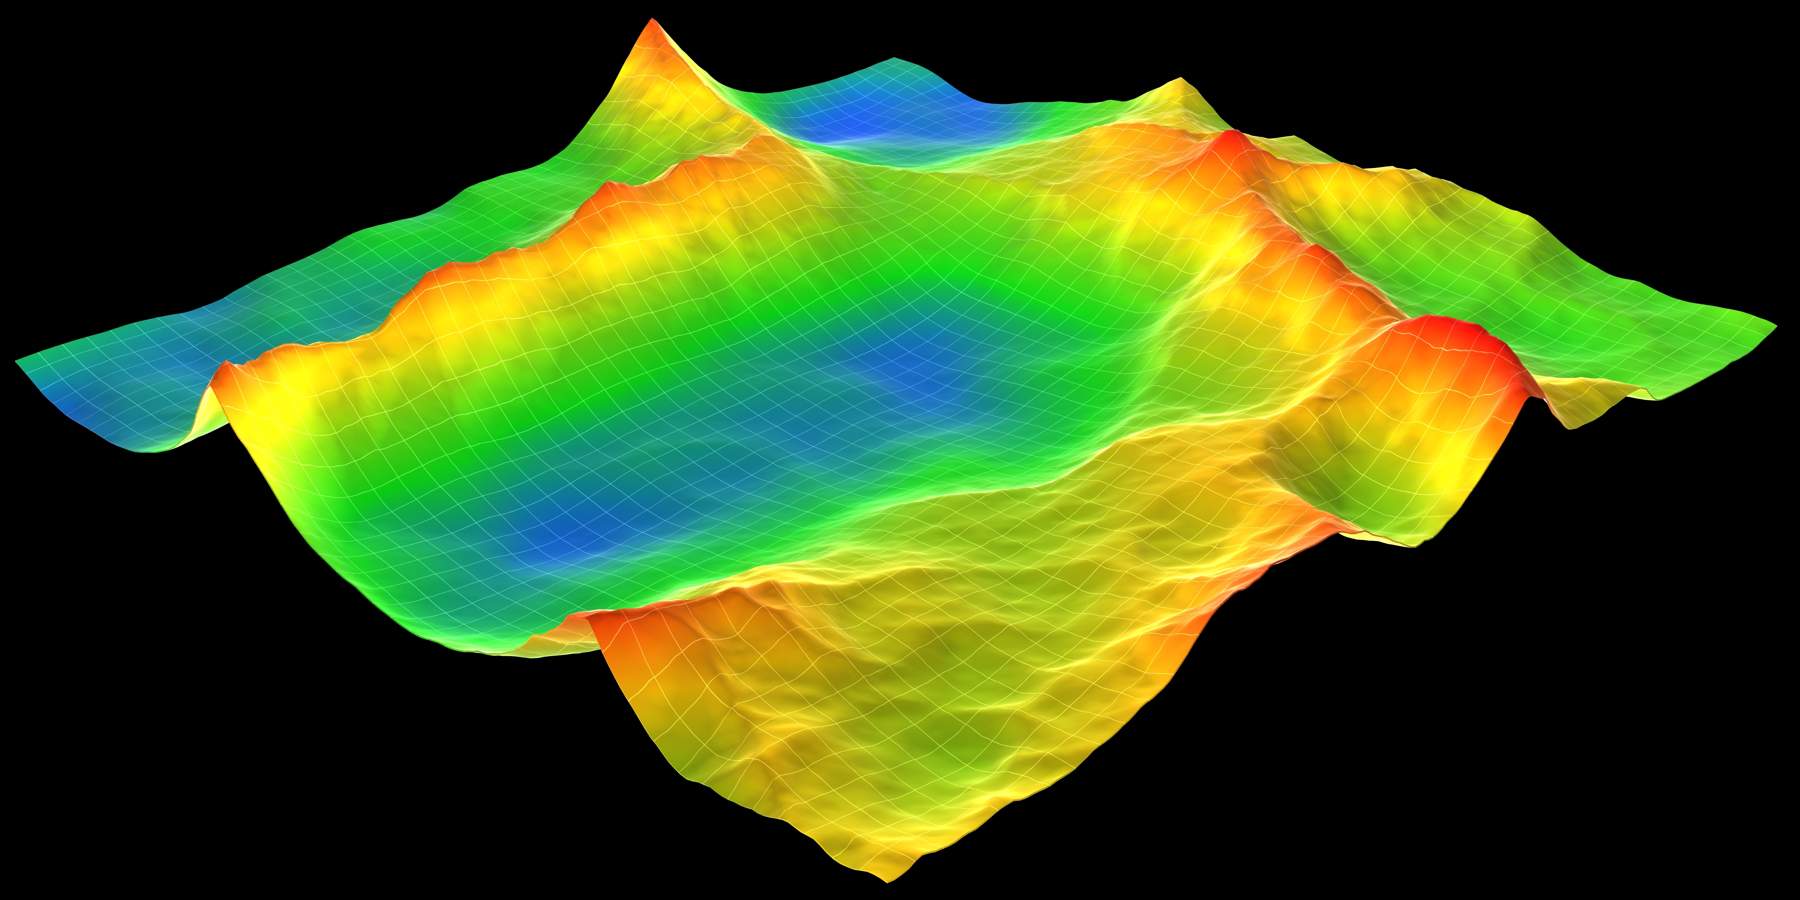
- 3D Data Visualization – Ideal for ensuring radical way to analyze and manage your data.